Monday, March 14, 2011

Components of Internal Model

  1. Future Written Premium
    • First move is to group business line and product line, so the separate projection of cash flow can be made. Each business lines and product lines have their own assumption and historical data to project the estimated future written premium.
  2. Future claims
    • To get future claims we will separate business line into following parts:
      • Catastrophe claims
      • Notified claims (incurred but not enough reported - IBNER)
      • Incurred but not reported – IBNR
      • Claims expected on the existing business
      • Claims from the future written business
  3. Future expenses
    • Some of the future claims are easily to calculate because it is simply a function of other assumptions, to make it clearer take an example of compensation paid to agents. It is simply a percentage of insurance products. Claims expense is again based on the extrapolation method to get the future claim expenses. Other expenses such as human resource cost and other are difficult to predict and can be identified by business owner and it is suppose to based on the growth strategy of an insurer. 
  4. Future investment Return
    • While calculating future investment insurer suppose to consider the market volatility and investment expenses
      •  Current investment portfolio
      • Prospects investment
      • Future investment policy of new business written by insurer
  5. Reinsurance
    • Assumptions about reinsurance which we will need to consider:
      • Existing agreement
      • New agreement may come into picture
      • Changes may happen in the existing agreement
  6. External environment
    • We will need to consider interest rate, inflation rate, currency ratio and other economical factor into account and it will be considered to each component of internal model.

Components
Data Needed
Gross written premium
  • Historical data of rate changes
  • Underwriter views
  • Business plans and targets

Reinsurance premium – ceded premium
  • Historical changes of reinsurance rates
  • Terms of reinsurance written in the contract
  • Insurer business plan
  • Credit rating of re-insurers
  • Data from rating agencies
  • Historical data re-insurers failures

Gross Claims
  • Historical claim ratios, frequencies and severities
  • Claim inflation
  • Terms and conditions changes
  • Underwriting view points on the extreme losses
  • Business plan
  • Historical and potential catastrophic events
  • Experts opinions on catastrophic events
  • Best estimated claims reserves
  • Number of reports and estimated IBNR claims
  • Past settled claims

Expenses
  • Historical data of firms
  • Insurer business plan
  • Inflation

Investment
  • Historical data of Inflation rate and current inflation rate
  • Historical data of Interest rate and current interest rate
  • Government bond yield rate (by duration and terms)
  • Equity return (by duration and terms)
  • Currency ratios
  • Exchange rates
  • Extreme events losses

Tax and Dividends
  • Rules from local taxation authority.
  • Board policy on dividend payments.

Friday, February 25, 2011

Internal Model

Resources of any company is treated as a capital, so any resources of a company is greater than its liabilities is called net capital available. As per solvency requirement insurer suppose to have excess capital than its liabilities. In fact, it will hold enough capital to insure that it will meet all the obligation of policyholder and beneficiaries to a certain degree of confidence. To obtain that degree of confidence insurer came up with 'capital modeling' concept, this is also known as internal model in the language of solvency II. Internal model help insurer to allocate capital between classes, product and individual policies. 


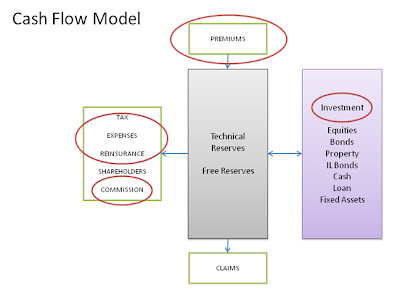
Internal model is based on the cash flow model in which insurer suppose to assess its future business to meet its capital obligation. Therefore a range of assumption will require, including: 
  • future written premium income 
  • future claims, on current and future business, and the timing of these claims 
  • future reserving basis 
  • future expenses 
  • investment return 
  • reinsurance arrangements, costs and recoveries, potential reinsurance exhaustion 
  • economic variables such as future inflation and interest rates 
  • likelihood / cost of catastrophes 
  • the insurance cycle 
  • operational losses 
  • tax 
  • dividends

Friday, February 11, 2011

Basics of Solvency II (Part 2)

The Solvency II framework are based on the three pillar approach which is somewhat similar to banking regulation of Basel II.
The three pillar approach of Solvency II are:
  • Pillar I: Quantitative requirements for measuring financial position and capital adequacy.
  • Pillar II: Insurers’ self-assessment of capital needs and capital/risk management processes and procedures subjected to supervisory scrutiny.
  • Pillar III: Increased market transparency through greater disclosure and reporting requirements.


(Re)Insurer should know their current solvency ratio, and start identifying key risk indicators (KRIs). Set targets for their reserves and critical business processes. Redefine the role and responsibilities of KRIs owners and establish methodology to measure and control their risks (KRIs).
What is KRIs?
KRIs: Key risk indicators (KRI) are measurements that are used by organization to illustrate how risky an activity is. 


Following figure would able to highlight  some of the KRIs focus area.


Wednesday, February 9, 2011

Basics of Solvency II (Part 1)

To understand better about Solvency II, lets start with solvency concept.
What is Solvency Margin?
Solvency Margin: In a simple word to describe solvency margin of an (re)insurance Inc is when the assets exceed the liabilities.
How to calculate Solvency Margin Ratio?
Solvency Margin Ratio: It is solvency margin divided by written premium, not the solvency margin divided by total assets.
Balance sheet of any organization is a snapshot of its financial capability at the stated date of balance sheet. Therefore balance sheet of any (re)insurance company would tell you the summary of its financial status at particular instant. So to understand solvency of an insurance company it’s better to start with reviewing its balance sheet.
Balance sheet of any (re)insurance company looks like this:
Free reserves: It is a balancing piece which equal to the excess of assets over insurance liabilities.
Technical reserves: These are the amounts set aside in respect of expected payments to or on behalf of policyholders.
Investments: These might be bonds, equities, cash, property etc.
Fixed assets: For example, office building and equipment.
Net current assets: Excess of current assets over current liabilities, e.g. money due from brokers.

SCR (Solvency capital requirement): This fund is used to settle significant losses from uncertainly and provide assurance to policyholders and stakeholders that payment will be made. If the insurer did not have an adequate level of solvency reserve, policyholders would have no reason to believe that the insurer would be able to meet claims in the event of disaster.

MCR (Minimum capital requirement): Legislative requirement which says financial resources should not fall from this level.


Tuesday, February 8, 2011

Key Challenges of Solvency II

Solvency II is a review of capital adequacy regime for insurers in European Union, which aim to establish a revised set of risk based capital requirements, valuation techniques and risk management standards.
Solvency II directives focus on the capital requirement of (re)insurer which will be impacting the risk model and decision making strategies of insurance firms. There is a causal loop impact on the insurance business model; the report generated by internal model would change the way insurance do business.
One of the biggest impacts from Solvency II on insurance companies is the expectation for senior management to express in-depth understanding of the framework, improved management of their capital and better decision-making as a result of their identification of key organisational risks.
The aftermath of solvency II regime will be the change in the behaviour of business processes of (re)insurer. There will be a requirement to establish key risk indictors (KRIs) on the critical business processes i.e. underwriter, claims, product development, new business, agency management etc to monitor the risk.

The key challenges of solvency II for (re)insurance firms will be the following:

  • Revamp or new Risk & Actuarial Models: Realistic valuation of assets and liabilities in the balance sheet. Calculation of Technical provision, Best estimation and Risk margin. 
  • Data Management: Data management would be the first priority for every (re)insurer which includes data availability, data accuracy and data consistency.
    • Data availability: Extreme events data
    • Data Accuracy
    • Data Consistency
    • Data Formats & granularity
    • Data Integration: Integration of different functional data as well as integration of data with the external environment like current inflation rate, interest rate, extreme events. etc.
  • Regulatory reporting: Solvency II also insisted on building up transparency between insurer, reinsurer, policy holders and stake holders. CEIOPS proposed following reports:
    • SFCR: It is a public disclosure reports 
    • RTS: The RTS is not public and is communicated only to the firm's supervisor. The RTS expands on the SFCR's disclosures using a similar, prescribed structure but this time presenting the information differently as part of the ongoing supervisory dialogue with the firm.
  • New controls within processes: Supervisor authorities or senior management would set key risk indicators to manage business processes.
  • Business Process Re-engineering: Good control management would open a new opportunities to rectify or revamp the sick business process areas.